Statamic Addon
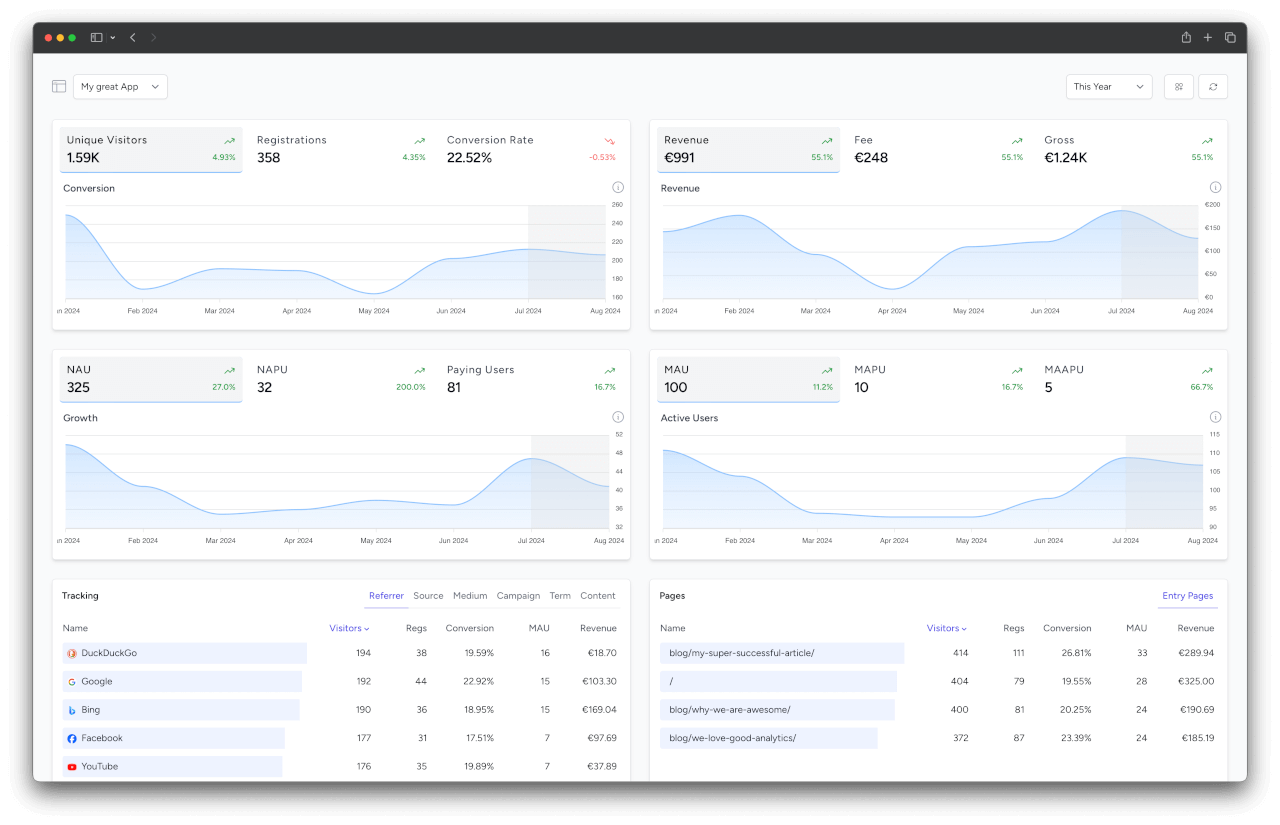
The SimpleStats Statamic addon adds a full analytics dashboard directly inside your Statamic Control Panel. Instead of switching between your site and the SimpleStats dashboard, you get visitor trends, revenue charts, conversion rates, and traffic sources right where you already work.
Requirements
- PHP 8.2+
- Statamic 6+
- A SimpleStats API token
TIP
The addon uses the same SIMPLESTATS_API_TOKEN as the Laravel client package. If you already have the client installed, you don't need a second token.
Installation
Install the addon via Composer:
composer require simplestats-io/statamic-addonAdd your API token to your .env file:
SIMPLESTATS_API_TOKEN=your-api-token-hereThat's it. A new SimpleStats entry appears under the Tools section of the Control Panel navigation. Open it to see your dashboard.
Configuration
All configuration is optional. The addon works out of the box with just an API token.
Publishing the Config File
If you want to override the defaults, publish the config:
php artisan vendor:publish --tag="simplestats-config"This creates config/simplestats.php:
return [
    'api_url' => env('SIMPLESTATS_API_URL', 'https://simplestats.io/api/v1'),
    'api_token' => env('SIMPLESTATS_API_TOKEN'),
    'cache_ttl' => 60,
];
All values can be set via environment variables.
Widgets
The dashboard includes seven pre-built widgets:
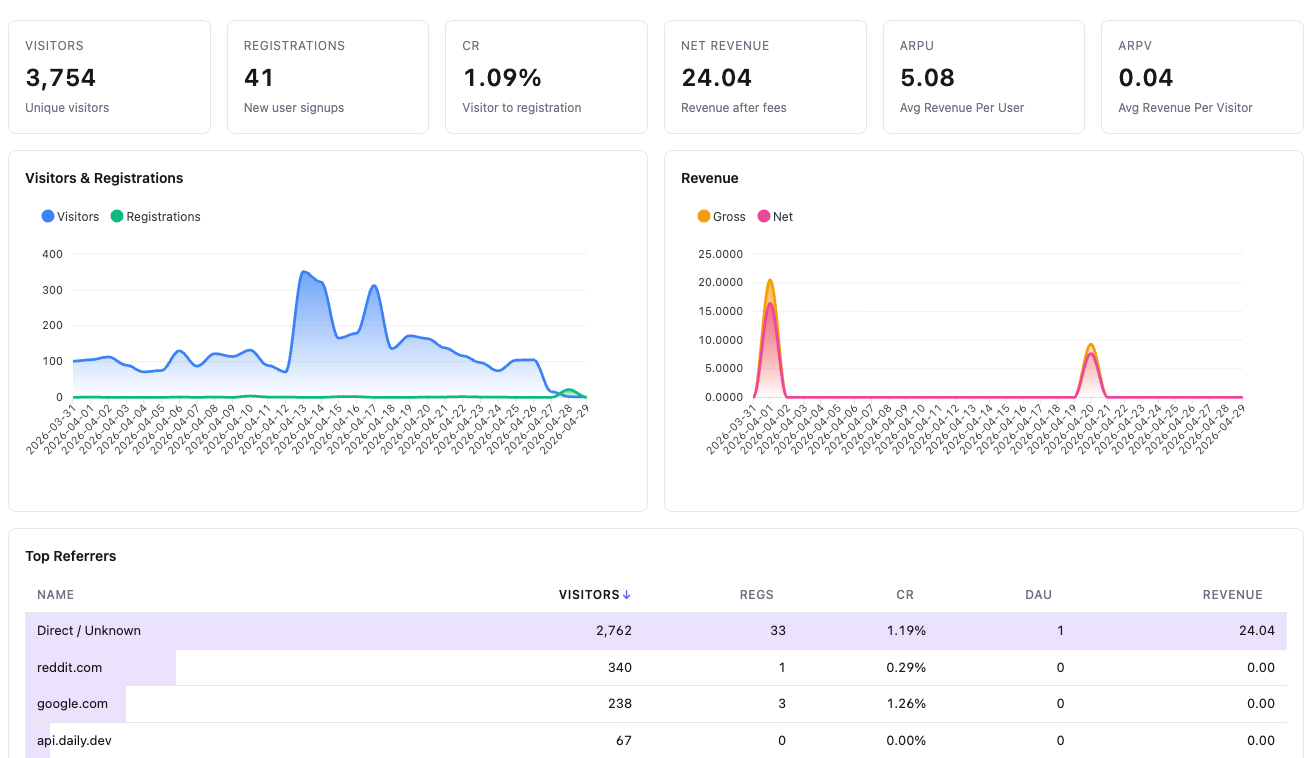
Stats Overview
Six KPI cards at the top of the dashboard:
- Visitors and Registrations with trend indicators
- CR (Conversion Rate) from visitor to registration
- Net Revenue in your team's default currency
- ARPU (Average Revenue Per User)
- ARPV (Average Revenue Per Visitor)
Each card shows the percentage change compared to the previous period when a comparison is active.
Charts
- Visitors & Registrations Chart: Line chart showing both metrics over time, with optional comparison period overlay
- Revenue Chart: Gross and net revenue trends over the selected time range
Top Lists
- Top Sources: Traffic sources ranked by visitor count (utm_source)
- Top Countries: Geographic distribution of visitors
- Top Referrers: Referring domains that send visitors to your site
- Entry Pages: Landing pages where visitors arrive first
Time Range Filter
The dashboard includes a time range dropdown with the following presets:
- Today / Yesterday
- Last 7 Days / Last 30 Days
- Last 12 Weeks / Last 6 Months
- This Month / Last Month
- This Year / Last Year
- All Time
The default is Last 7 Days. All widgets update automatically when you change the filter.
Caching
API responses are cached to keep the dashboard fast and reduce API calls. Multiple widgets sharing the same filters reuse a single cached response.
- Default TTL: 60 seconds
- Set
cache_ttlto0to disable caching - Uses your application's default cache driver
// config/simplestats.php

'cache_ttl' => 300, // 5 minutes
Self-Hosted
If you're running a self-hosted SimpleStats instance, point the addon to your own API via .env:
SIMPLESTATS_API_URL=https://stats.yourdomain.com/api/v1
SIMPLESTATS_API_TOKEN=your-api-token-here
Error Handling
The addon handles API failures gracefully. If the API is unreachable or the token is invalid, widgets display empty states instead of throwing errors. Connection issues are logged as warnings for debugging.