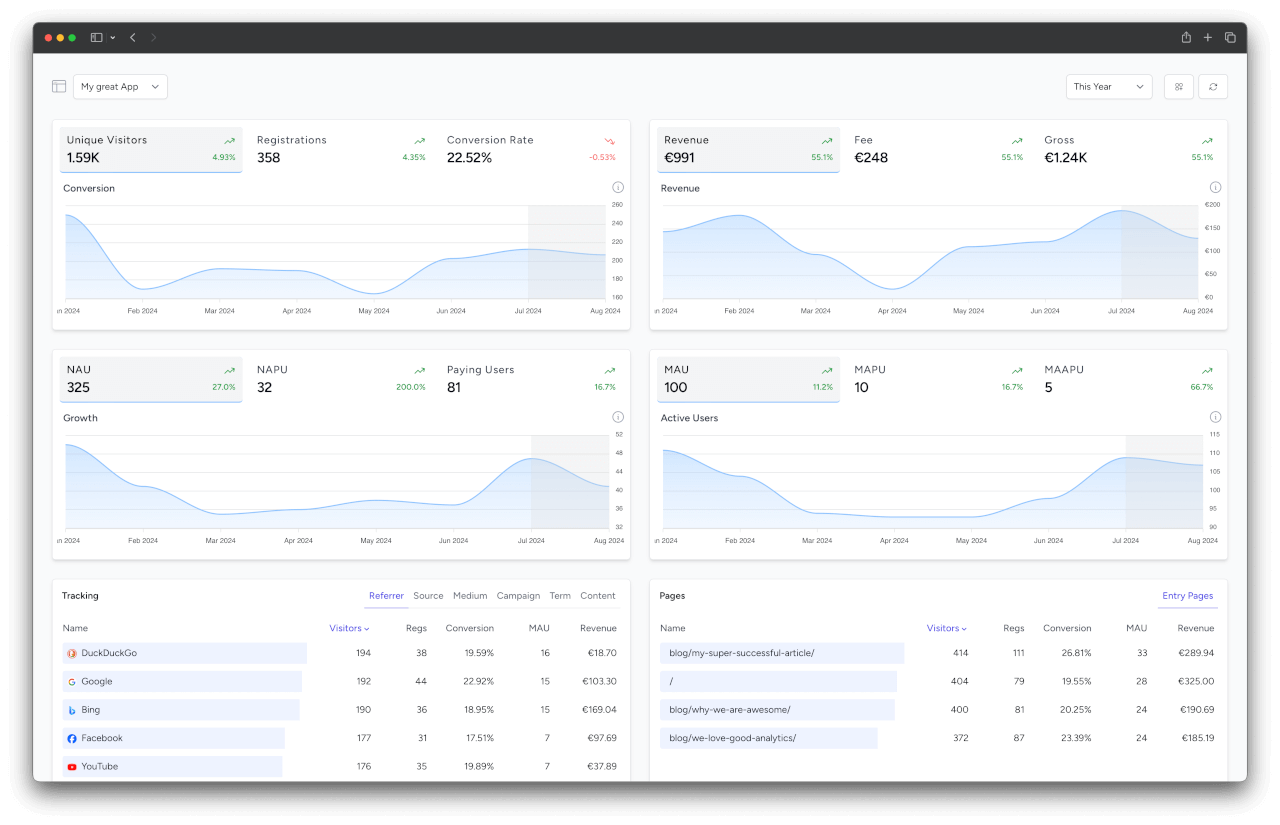
Key Performance Indicators (KPIs)
SimpleStats turns your raw tracking data into actionable KPIs across acquisition, revenue, retention, and recurring revenue. This page is the full reference for every metric we compute, what it means, and how it is calculated.
INFO
Don't worry if you do not understand the list below immediately. It's much easier to grasp once you see these numbers in action on your dashboard.
Which KPIs apply to your project depends on what you track. A content site that only tracks visitors will never see revenue metrics, while a subscription SaaS gets the full picture including the recurring revenue section.
Core KPIs
| Key | Short | Description |
|---|---|---|
| VISITORS | Unique Visitors | Number of unique visitors for the selected period. |
| REG | Registrations | Number of new registrations for the selected period. |
| CR | Conversion Rate | Percentage of unique visitors who registered at the selected period. |
| NET | Net revenue | Net revenue for the selected period. |
| FEE | Fee | Fee for the selected period. |
| GROSS | Gross revenue | Gross revenue for the selected period. |
| ARPDAU | Average Revenue Per DAU | The average revenue per DAU. |
| ARPU | Average Revenue Per User | The average revenue per User (how much is a user/lead/reg worth in money). |
| ARPV | Average Revenue Per Visitor | The average revenue per Unique Visitor (how much is a unique visitor worth in money). |
| NAU | New Active Users | Number of users who returned at the selected period to the app (=2nd login) after the registration (=1st login). |
| NAPU | New Active Paying Users | Number of users who did their first payment at the selected period. |
| PU | Paying Users | Number of users who did at least one payment over lifetime. |
| ARPPU | Average Revenue Per Paying User | The average revenue per paying User. |
| DAU | Daily Active Users | Number of users who logged in at the selected period (without 1st login = registration). |
| DAPU | Daily Active Paying Users | Number of users who logged in or registered at the selected period and did at least one payment over lifetime (including the selected period) |
| DAAPU | Daily Active Active Paying Users | Number of users who logged in or registered during the given period and did at least one payment in the last 20 days (including the selected period) |
| WAU | Weekly Active Users | Number of users who logged in at the selected period (without 1st login = registration). |
| WAPU | Weekly Active Paying Users | Number of users who logged in or registered at the selected period and did at least one payment over lifetime (including the selected period) |
| WAAPU | Weekly Active Active Paying Users | Number of users who logged in or registered during the given period and did at least one payment in the last 20 days (including the selected period) |
| MAU | Monthly Active Users | Number of users who logged in at the selected period (without 1st login = registration). |
| MAPU | Monthly Active Paying Users | Number of users who logged in or registered at the selected period and did at least one payment over lifetime (including the selected period) |
| MAAPU | Monthly Active Active Paying Users | Number of users who logged in or registered during the given period and did at least one payment in the last 20 days (including the selected period) |
| REG2DAU | Reg. to DAU | Percentage of registered users who become DAUs |
| REG2WAU | Reg. to WAU | Percentage of registered users who become WAUs |
| REG2MAU | Reg. to MAU | Percentage of registered users who become MAUs |
| REG2PU | Reg. to Pay | Percentage of registered users who become paying user. |
| TAU | Total Actives | Number of users who logged in at least twice over lifetime. |
| REG2TAU | Reg. to Active | Percentage of registered users who become active. |
Recurring Revenue
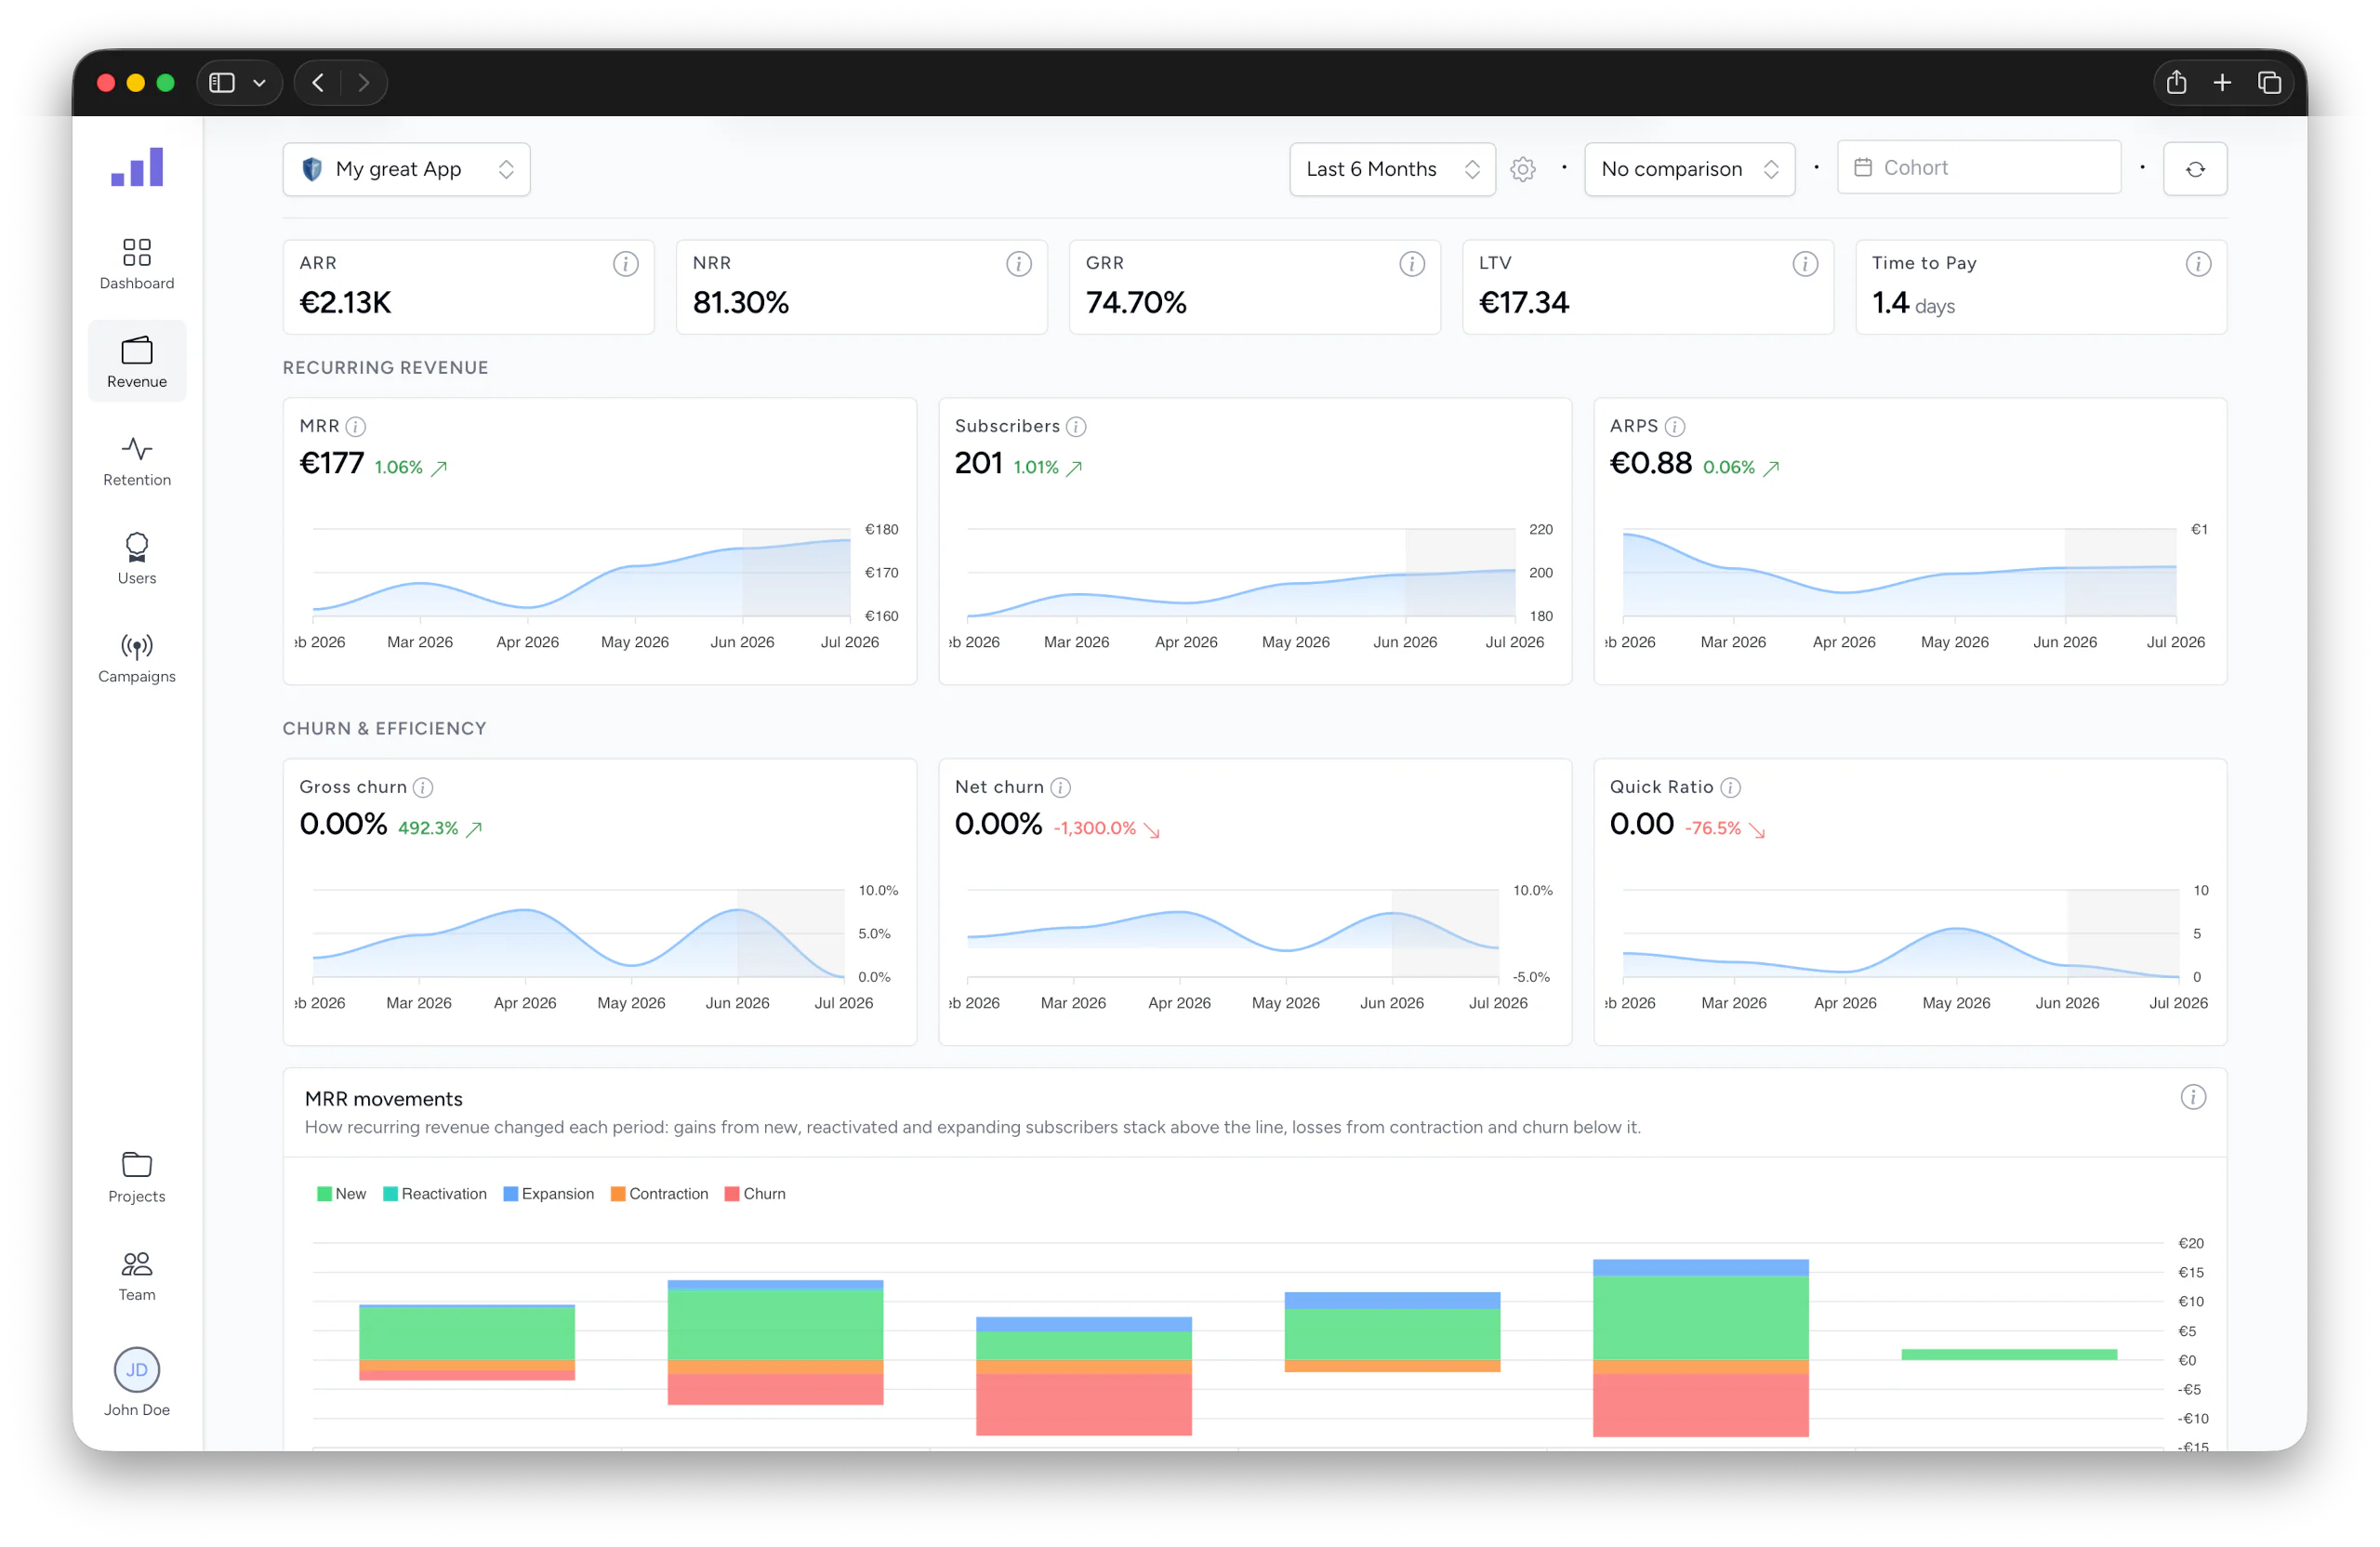
If your project tracks subscriptions, SimpleStats turns your recurring payments into the standard subscription-SaaS metrics. These are point-in-time figures: revenue snapshots are taken as of the end of the selected period, while churn and efficiency look at what changed across it.
| Key | Short | Description |
|---|---|---|
| MRR | Monthly Recurring Revenue | Active recurring revenue as of the end of the selected period, normalized to a monthly amount (yearly plans counted as net / 12). |
| ARR | Annual Recurring Revenue | Annualized recurring revenue (MRR × 12). |
| SUBSCRIBERS | Active Subscribers | Number of users with an active recurring payment within its interval window as of the end of the selected period. |
| ARPS | Average Revenue Per Subscriber | Average monthly recurring revenue per active subscriber (MRR ÷ Subscribers). |
| NRR | Net Revenue Retention | Recurring revenue retained from the customers active at the start of the period, including expansion: (start + expansion − contraction − churn) / start. |
| GRR | Gross Revenue Retention | Recurring revenue retained from the customers active at the start of the period, excluding expansion: (start − contraction − churn) / start. |
| LTV | Customer Lifetime Value | Average recurring revenue a subscriber generates over their lifetime: ARPS ÷ monthly gross MRR churn rate. |
| QUICK RATIO | MRR Quick Ratio | Growth efficiency over the period: (new + expansion) / (contraction + churn). Above 1 means recurring revenue gained outpaces revenue lost. |
| GROSS CHURN | Gross Revenue Churn | Share of the period's starting MRR lost to cancellations and downgrades (churn + contraction). Lower is better. |
| NET CHURN | Net Revenue Churn | Gross churn offset by expansion and reactivation. Below zero means expansion outweighed losses (net revenue growth from existing subscribers). |
Engagement & Retention
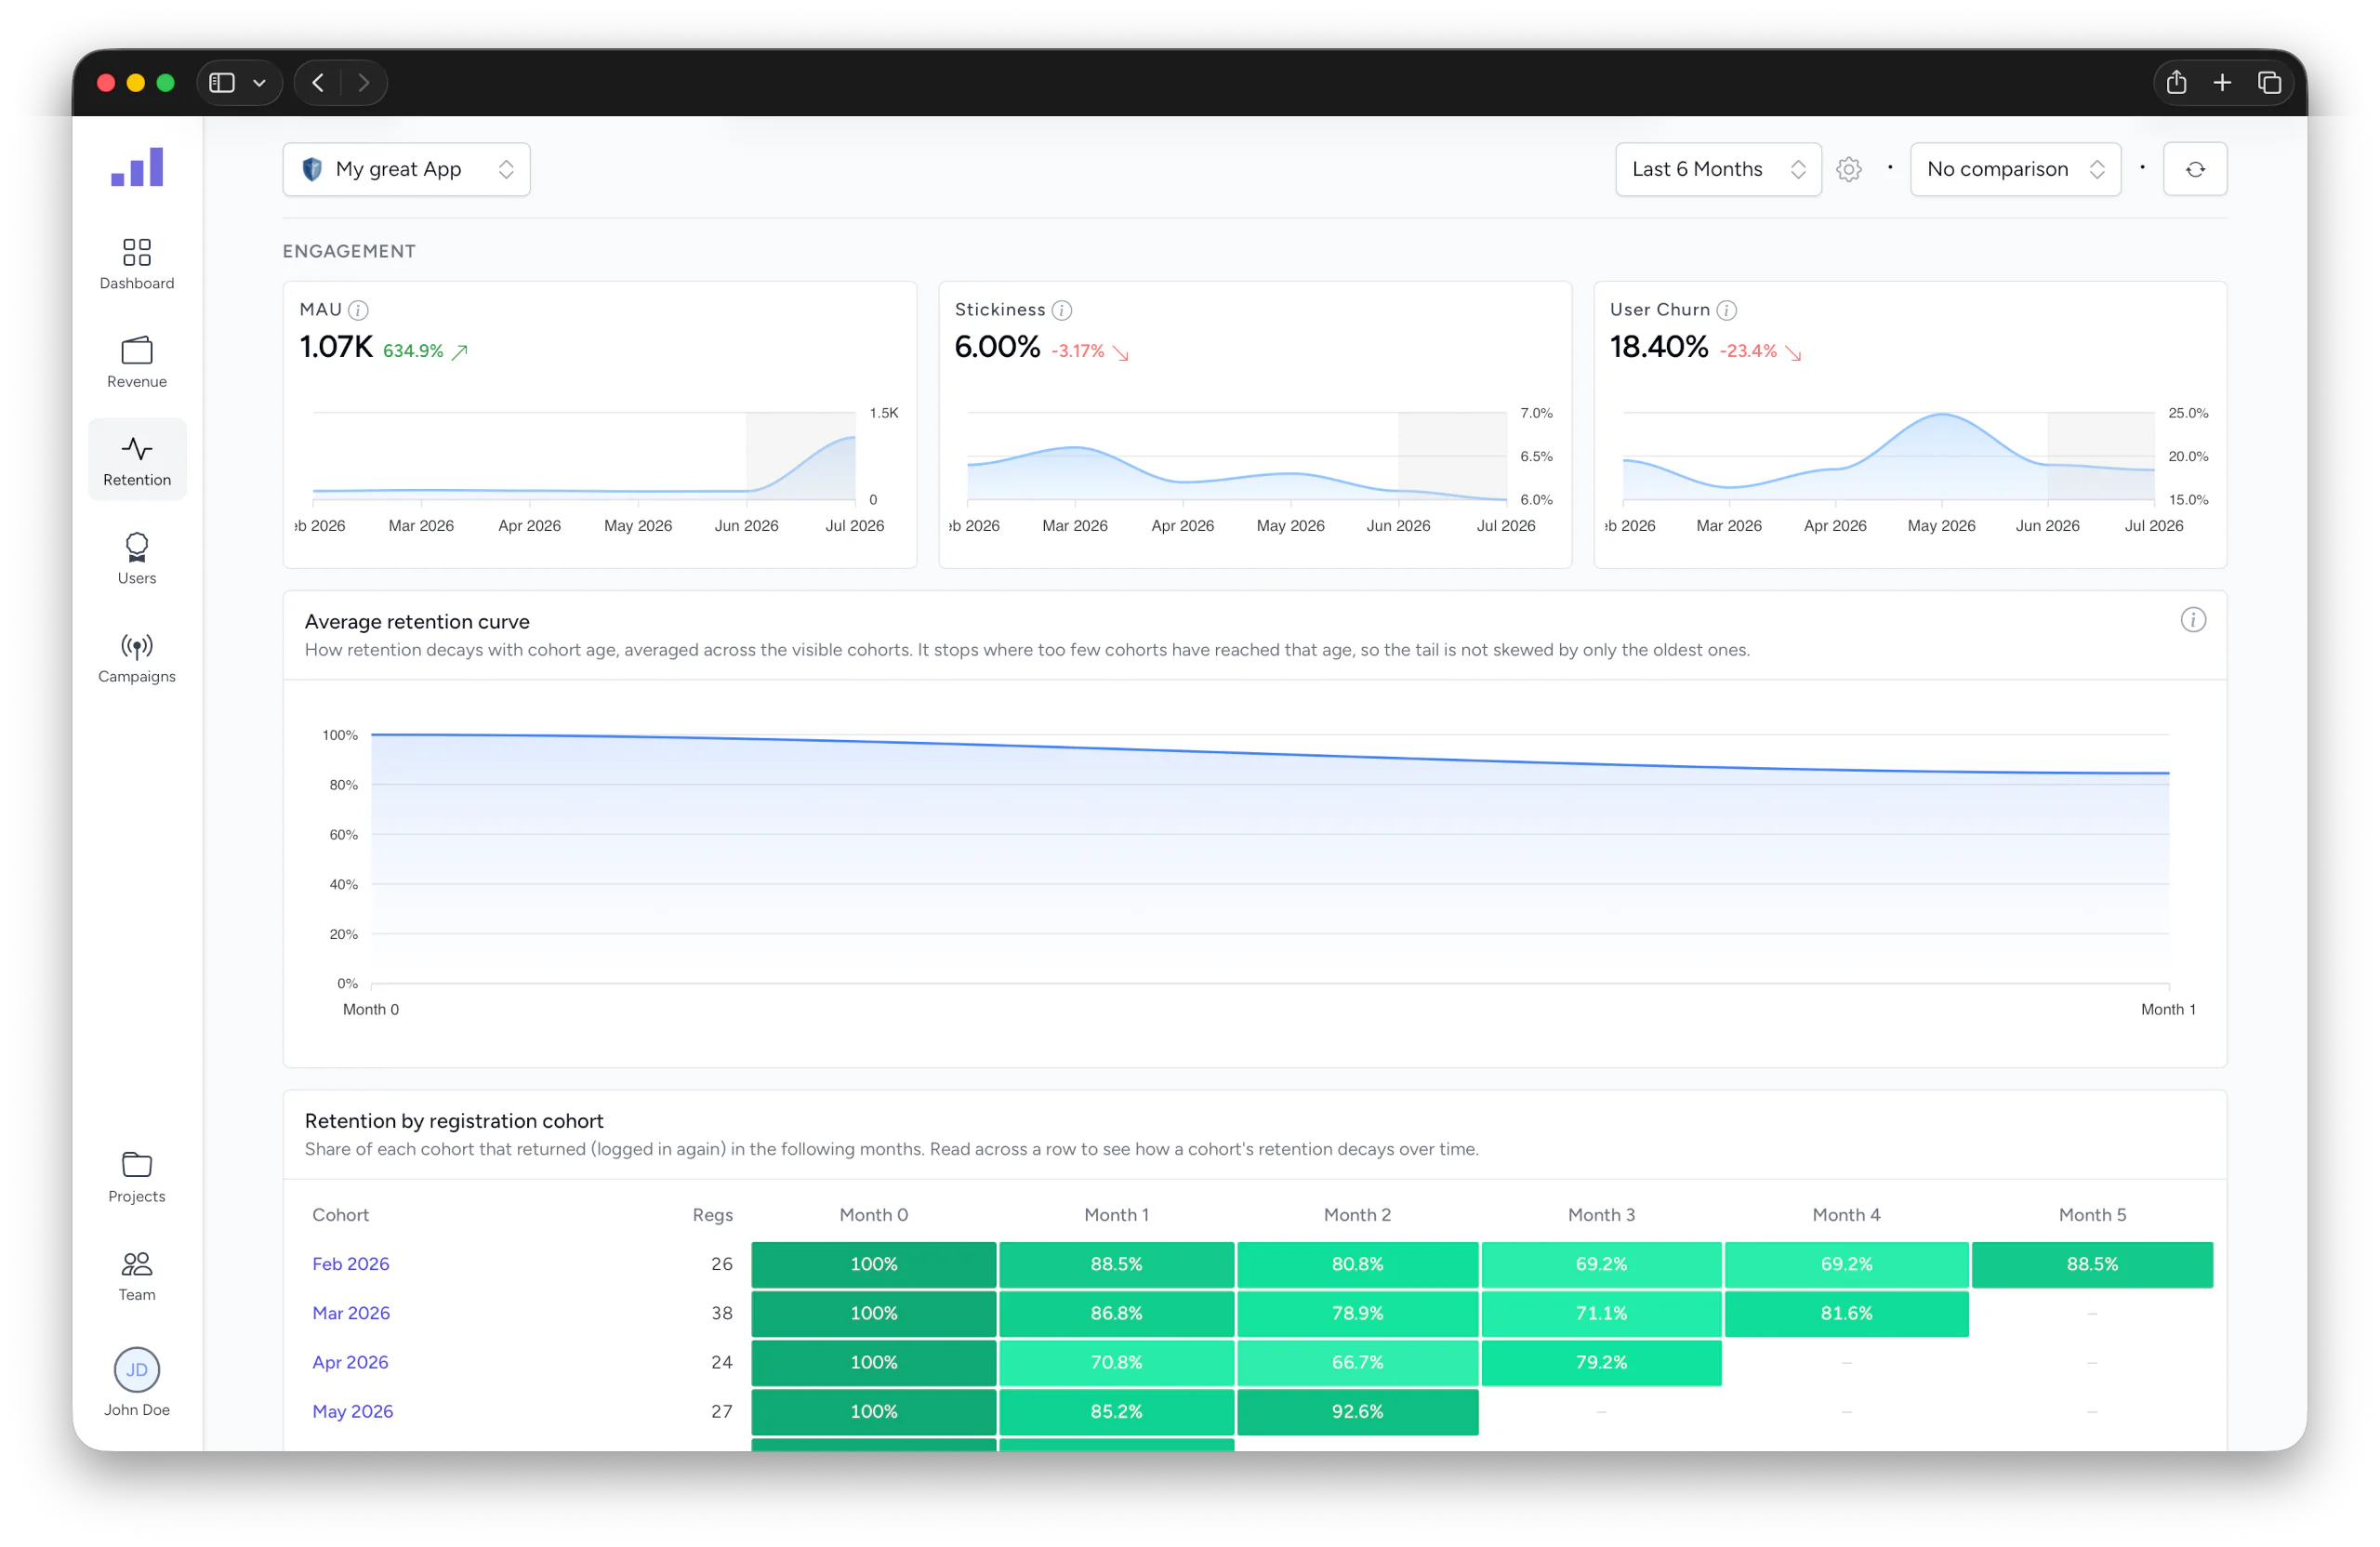
These metrics describe how reliably your users keep coming back. They are computed on rolling windows and plotted as of each period.
| Key | Short | Description |
|---|---|---|
| STICKINESS | User Stickiness | Average daily active users as a percentage of monthly active users (DAU/MAU) on a rolling 30-day window. Higher means your active users come back more often; 20%+ is a common benchmark. |
| USER CHURN | User Churn | Share of the preceding month's active users (30-60 days back) who did not log in again in the rolling last 30 days. Lower is better. |
Funnel Timing
How long it takes users to move through your funnel. Both are medians, by the date the step happened.
| Key | Short | Description |
|---|---|---|
| TIME TO CONVERT | Time to Convert | Median number of days from first visit to registration, by registration date. Only counts registrations linked to a prior visit. |
| TIME TO PAY | Time to First Payment | Median number of days from registration to first payment, for customers whose first payment falls in the selected period. |
Campaign Profitability
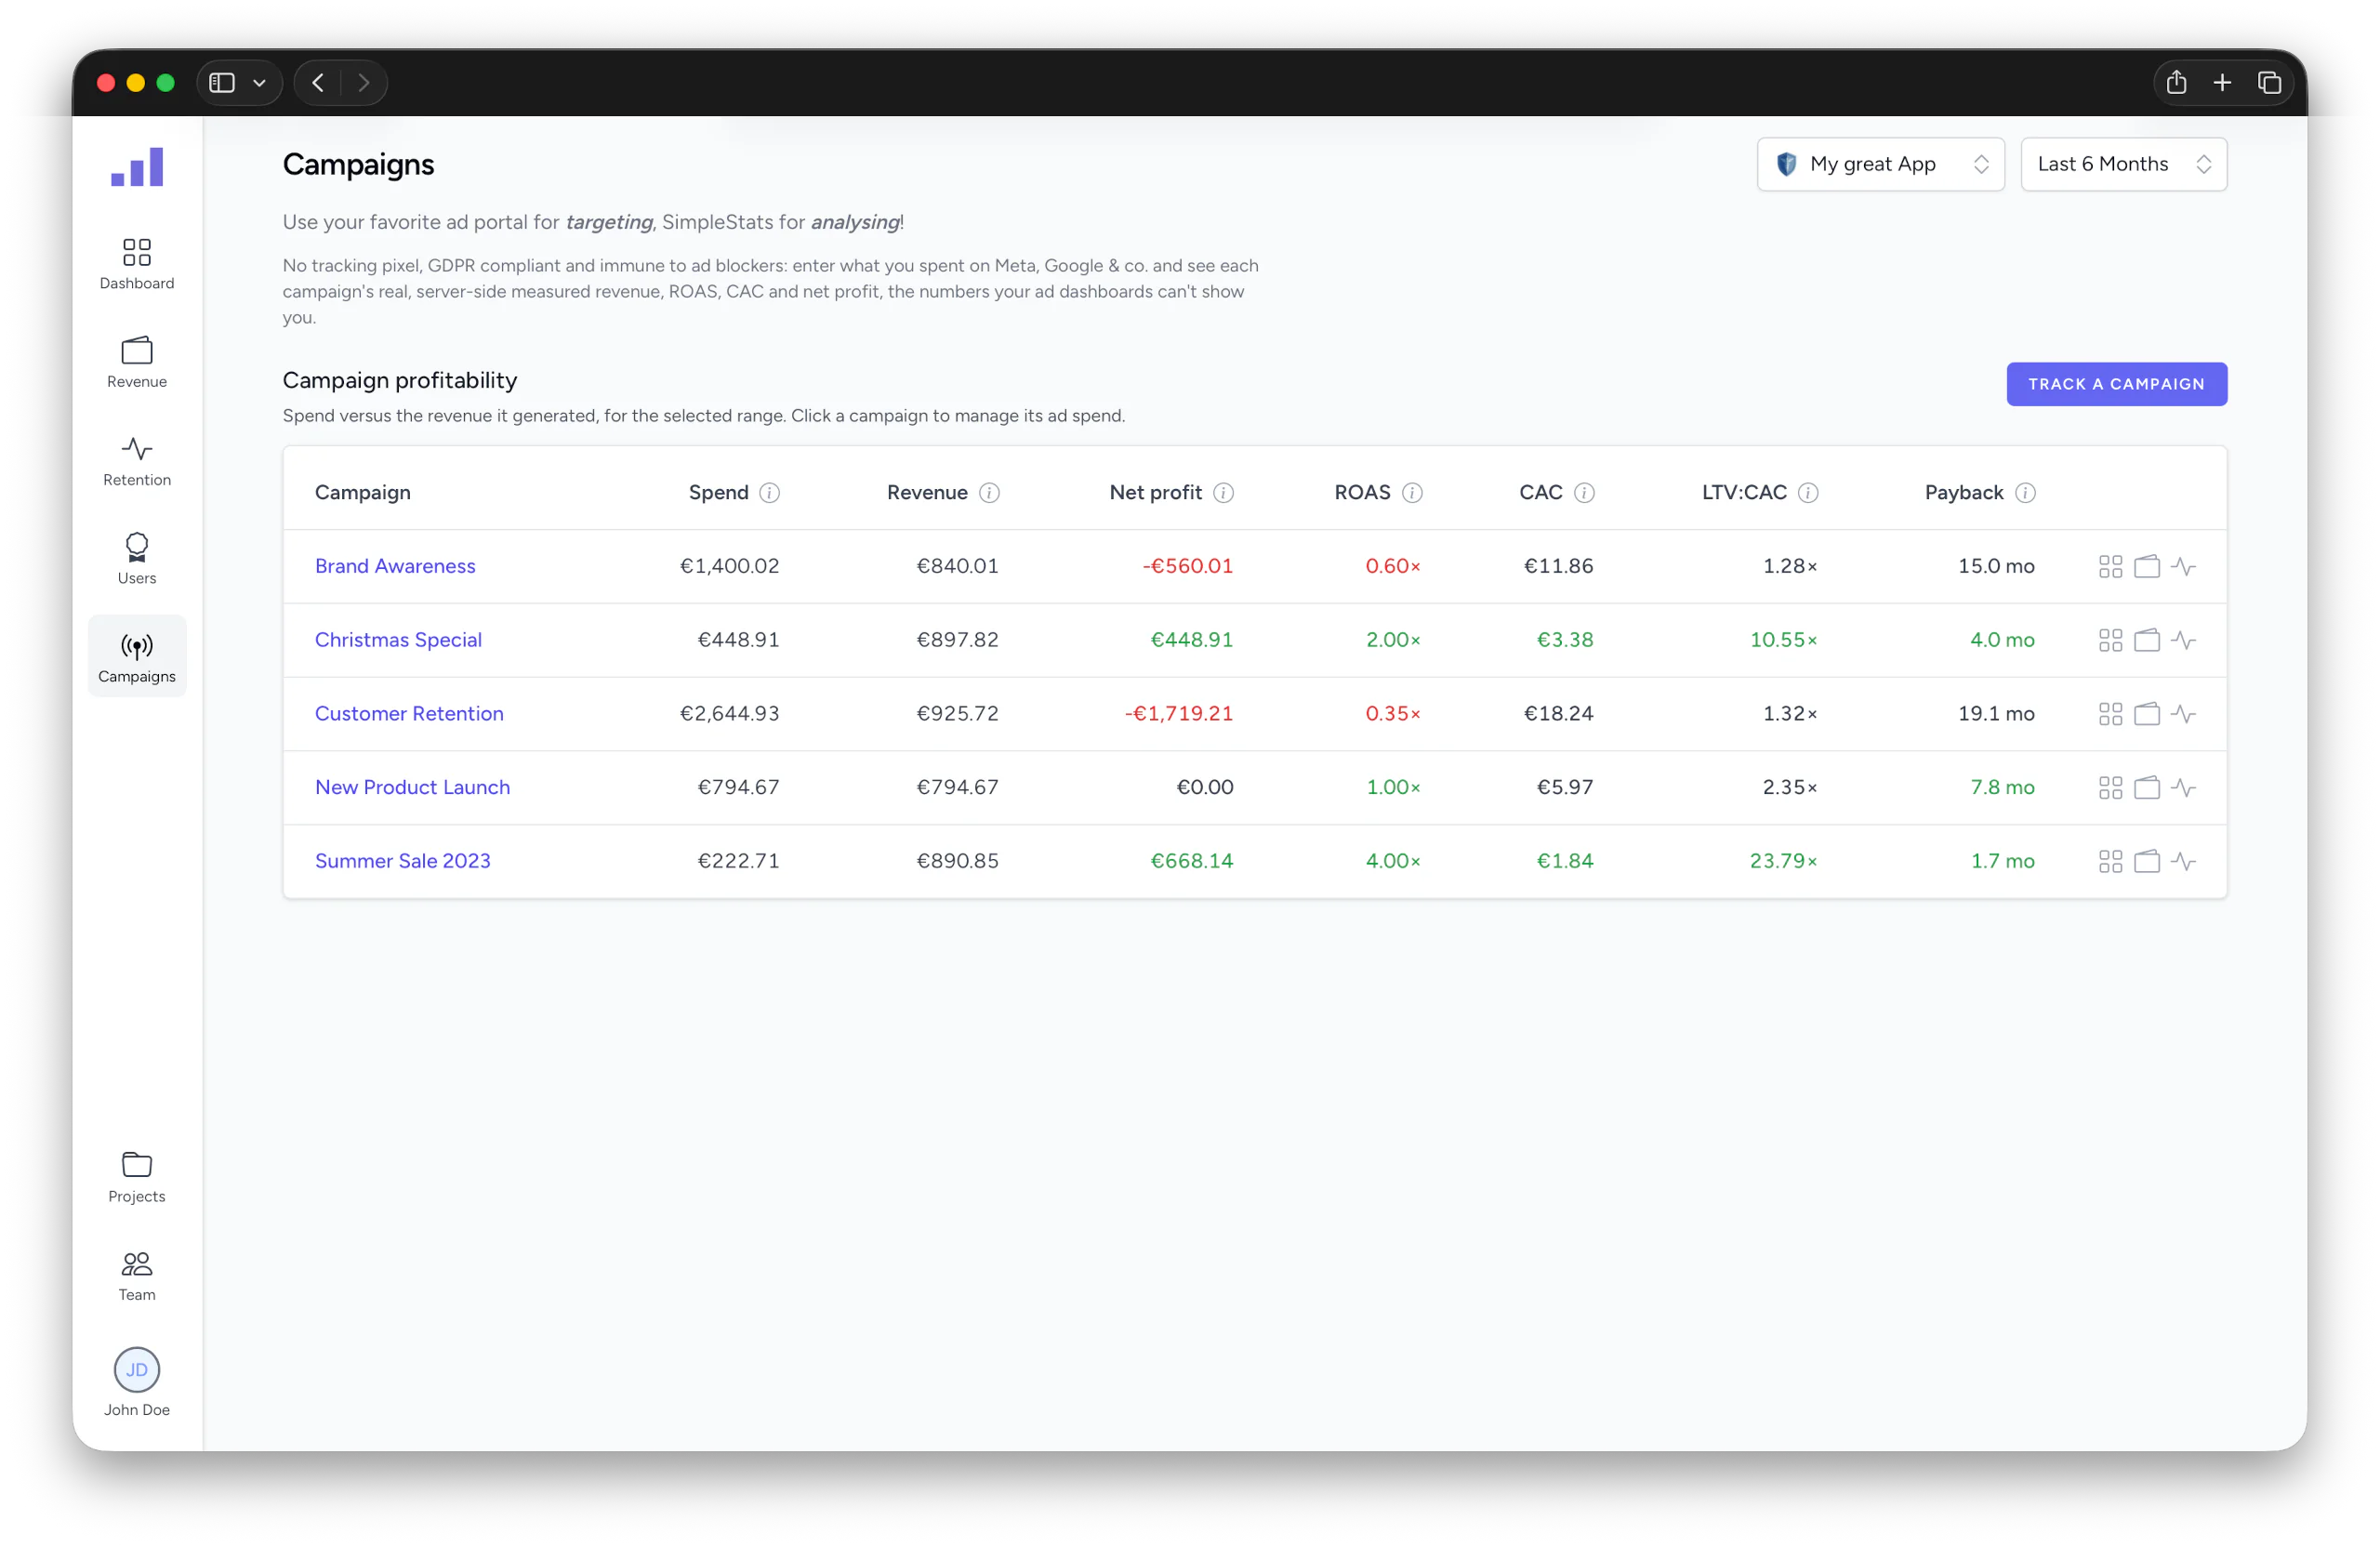
On the Campaigns page you enter how much you spent on ads per campaign (e.g. "Google Ads = 500 € from June 1 to June 30"). SimpleStats already knows the revenue each campaign brought in, so it turns your spend into profit metrics per campaign. These are not on the main dashboard, they sit directly on each campaign, because spend and return are always per channel.
| Key | Short | Description |
|---|---|---|
| SPEND | Ad Spend | What you paid for ads on this campaign during the selected period. Entered manually; days outside the period are prorated. |
| NET PROFIT | Net Profit | Net revenue from the campaign minus its ad spend. Positive means the campaign earned more than it cost, negative means it cost more than it earned. |
| ROAS | Return On Ad Spend | Revenue divided by spend. 2.00× means you earned 2 € back for every 1 € spent. Above 1.00× is profitable, below it the campaign loses money. |
| CAC | Customer Acquisition Cost | Ad spend divided by new registrations from the campaign. The average cost of acquiring one new sign-up. |